High Arctic weather is more extreme than that encountered in other parts of the earth. Cold temperatures and darkness are typical of the Arctic winter and, as cold air holds little moisture, most of the Arctic regions receive little precipitation. Thus, most Arctic regions are considered desertic or semi-desertic. During summer, the sun may shine for 24 hours, but the season nevertheless remains short and temperatures are only barely maintained above freezing. The difficult climate that characterizes the High Arctic is the major factor limiting life of arctic organisms. Therefore, recording weather variables is important for biologists in order to understand the driving forces that influence arctic ecosystems. This becomes even more true when considering that global climate models predict that over the course of the 21st century, Arctic summer temperatures could increase by as much as 4 to 8°C. Precipitation is also expected to increase from 10 to 20%, as well as daily and seasonal variability in both temperature and precipitation, leading to more frequent climatic extremes. Recent analyses indicate that temperatures in the Arctic have been increasing steadily over the last decades, and the extent and thickness of sea ice has also been reduced considerably.
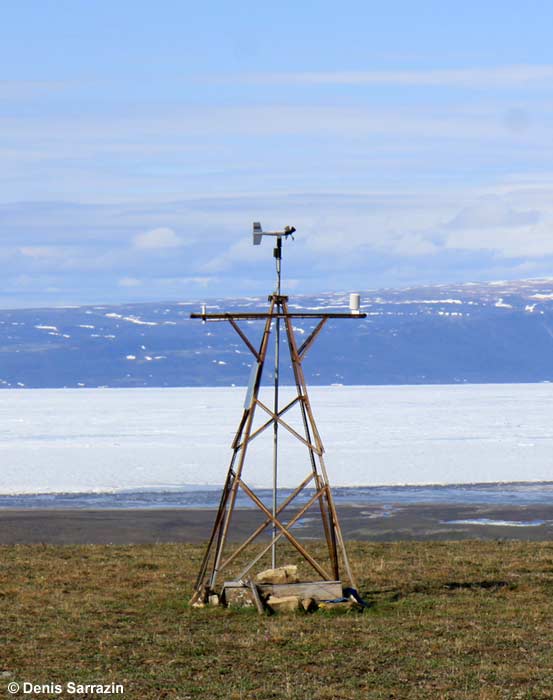
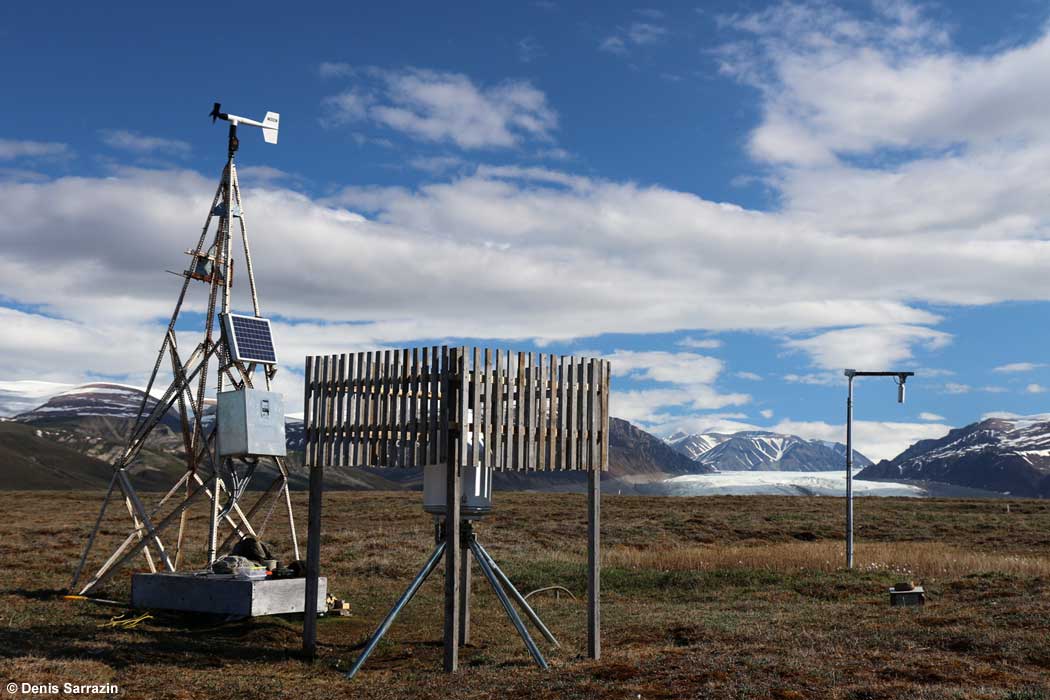
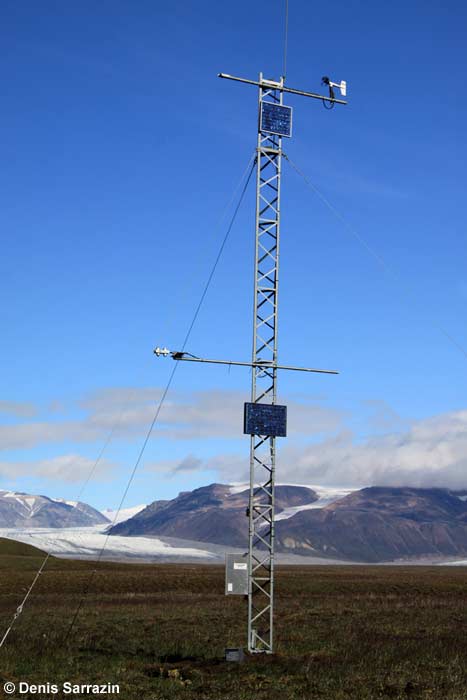
On Bylot Island, a weather database has been collected by automated weather stations since 1994. These stations are located in the Qarlikturvik Valley at an altitude ranging from 20 to 400 m above sea level and they possess sensitive sensors that record weather variables on an hourly basis. Summer precipitation is also recorded manually with the help of an instrument, called a rain gauge, that gathers rain into a graduated cylinder in order to read how many millimeters of rain have fallen. We present here some of those data overtime. Full datasets are available in Nordicana D (see publications D2 and D8).
 |
 |
 |
| BYLJACK station | BYLCAMP station | BYLOSIL station |
Air temperature
The annual air temperature varies greatly from year to year on Bylot Island with some years standing out as being exceptionally warmer (e.g. 2010) or colder (e.g. 2004, 2015 and 2018) than the others. The average yearly temperature since 1995 is -14.4°C. The warmest month of the year is July, with an average of 6.4°C and the coldest month is February with an average -34.8°C. So far, analyses of the air temperature have shown no detectable trend in annual temperature on Bylot Island.
Throughout the seasons, air temperature also varies among years. During the spring (March-April-May), the average air temperature is -19.4°C, during the summer (June-July-August) this average rises to 4.7°C while it decreases during the fall (September-October-November) to -11.0°C to get to its lowest average during the winter (December-January-February) at -32.4°C. When looking at seasonal temperature, a weak summer warming trend was detected with seasonal temperature gaining 0.2°C every ten years. During the winter, temperature also gained around 0.4°C per decade since 1995. During the fall, temperature gained around 0.5°C per decade since 1994. For the spring, analyses have not identified any warming or cooling trends.
 |
|
Based on our air temperature data, we can calculate the thawing degree-days (TDD) and the number of frost-free days. The thawing degree-days is a sum of all daily temperatures above 0°C. It therefore represents heat accumulation, an important factor influencing plant growth and plant life events (such as flowering). On Bylot Island, the sum of all daily temperatures above freezing, over the entire year, averages 467 TDD with 94% of that heat accumulated during the summer months, mostly during July (195 TDD) and August (158 TDD). Thawing degree-days show the same pattern as average summer temperatures (see seasonal graph above) with 1996 being the year with the lowest TDD and 2009 the highest TDD ever recorded so far on the island. Similar to summer air temperature, heat accumulation on Bylot Island also shows a weak increasing trend of 13 thawing degree-days every decade since 1994.
Each year, animals and plants living on Bylot Island experience an average of 102 days of frost-free days between the months of May and September. Obviously, the majority of these days occur in the summer months (June-July-August). On Bylot Island, the number of frost-free days was very low in 1997 because the month of September was exceptionally cold (average air temperature of -5.4°C) while 1998 had the highest number of days above 0° due to the month of September being particularly warm (average air temperature of 2.8°C) compare to normal (long-term average for September: -1.1°C). Analyses have not identified any trends in the number of frost-free days since 1994.
Precipitation
On Bylot Island, summer precipitation is recorded manually. Indeed, data from 1 June to 17 August have been consistently recorded since 1995. The average amount of rainfall received during that period is 77.5 mm. July is usually the wettest month of the summer with an average of 36.9 mm of rain. So far, 2015 has been the driest summer on records (8.5 mm) while 2012 was the wettest summer with a total of 153 mm of rain. Overall, a decreasing trend of 21 mm per decade has been observed in the total amount of rain received during the summer on the island.
For the rest of the year, our weather station provides a measure of snow thickness on the ground. For most of the year, snow cover remains thin, with an average of 16.2 cm. However, in May the snow cover increases dramatically to an average of 29.2 cm. This increase is directly related to changes in air temperature that becomes warmer in the spring (see Annual snow depth in Arctic climate).
Wind speed
Summer is the windiest season on Bylot Island, with an average wind speed of 10.1 km/h. Contrarily, the cold air mass of the winter is more stable, and the wind speed average is 3.6 km/h. Through spring and fall, wind speeds are intermediate between the summer and winter with averages of 5.2 km/h and 7.4 km/h, respectively.
| Thermal profil of arctic soils |
