Climate is defined as the average weather conditions in a place over many years. It is described by a set of climate variables including air temperature, wind speed or the amount of precipitation that falls in the form of snow or rain. A specific region climate can be determined by measuring its weather conditions over a long period of time and then calculating the different climate variables. Those weather conditions are measured with automatic weather stations which are tall towers equipped with instruments that record, for example, the intensity of incoming solar radiation, the air temperature, the height of the snowpack and the windspeed. The main advantage of those weather stations is that they record weather data automatically all year long without supervision. There are several weather stations installed on Bylot Island which have been recording weather data since 1994.
Knowing about climate is interesting because it affects everything in our lives: it determines what kind of animals live around us, which plants grow, which clothes and types of houses we need or whether today will be cold or warm. In the Arctic, where community life is very close to nature, climate has an especially large influence. It determines the abundance of animals that can be hunted and provide food, it determines how much snow falls and when the sea freezes or melts. In other words, the climate is the framework in which the ecosystem and human society evolve. However, the climate is not constant but changes over time, which has an important impact on plant and animal life as well as on human society. To notice changes in climate and to learn about the possible impacts, the climate must be monitored constantly and over long periods of time. By monitoring the climate, scientists have shown that it is currently changing a lot and that the world is getting warmer, especially in the Arctic.
Climate on Bylot Island
 |
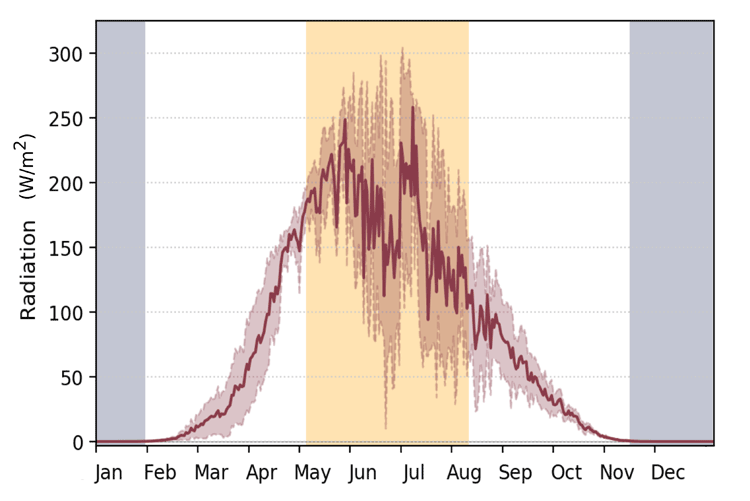
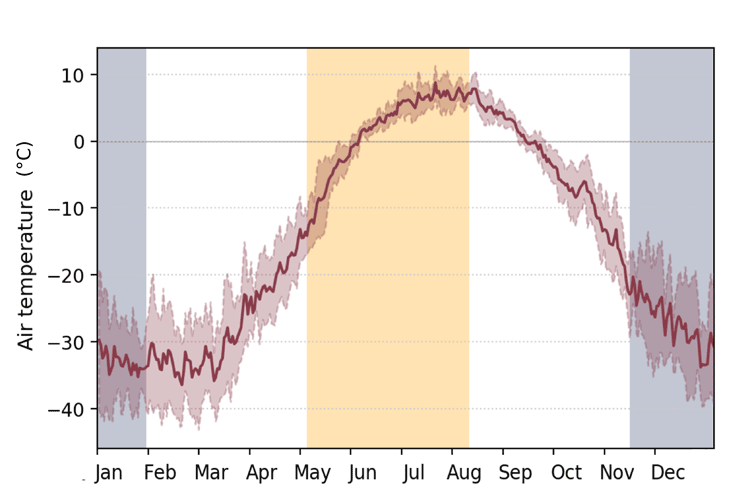
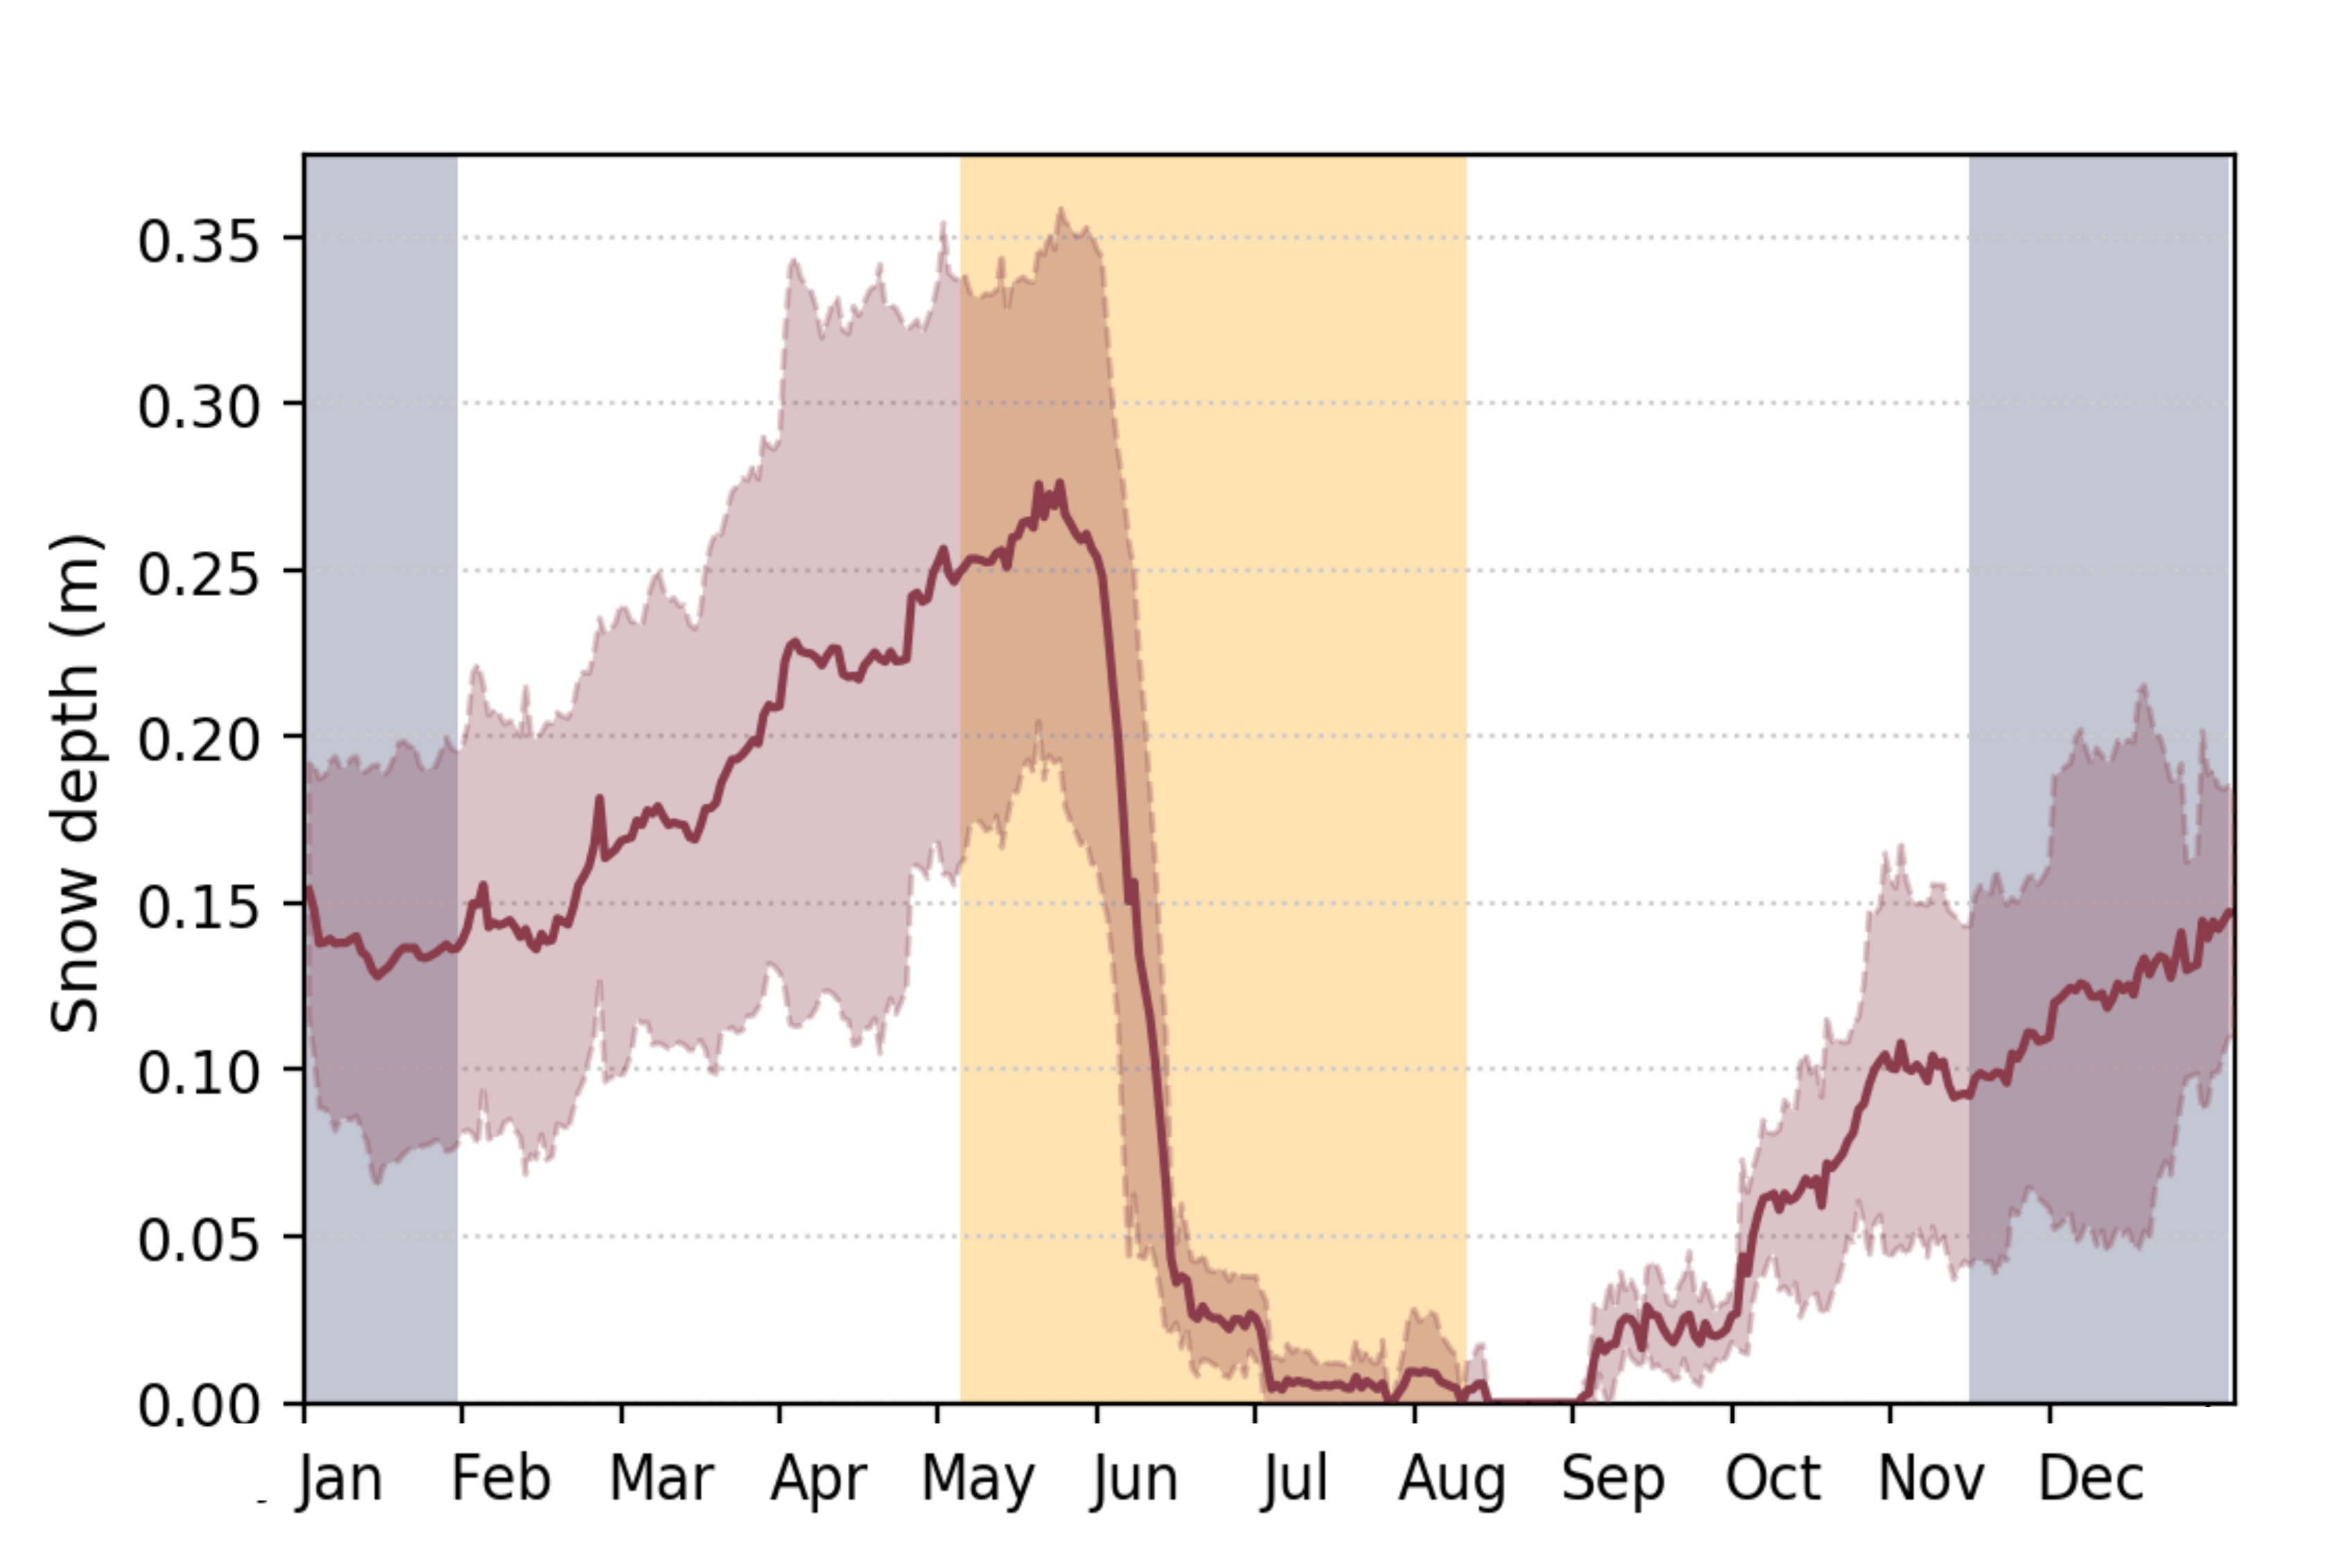
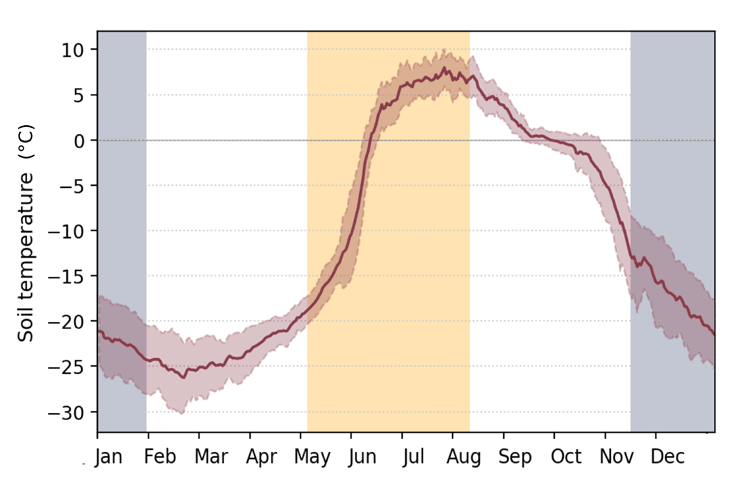
On Bylot Island, the climate is strongly controlled by the alternation of polar night and day. Polar night refers to the period when the sun does not rise and the days consist of 24 hours of darkness, a period that lasts from the beginning of November to the end of January (blue shaded area in figure). In contrast, polar day is the period when the sun never sets, and the days consist of 24 hours of light. This period lasts from early May to early August (orange shaded area in figure). As polar night and polar day alternate, the amount of energy that arrives from the sun varies a lot. The incoming solar energy, also called solar radiation, is directly connected to climatic variables because it is the sun energy that warms the air and the soil. The amount of incoming radiation therefore determines air temperatures and snow cover, and controls soil temperatures. The direct connection between incoming solar radiation and climatic variables becomes clear when looking at their annual variation, shown in the figures below. |
 |
Annual solar radiation - The red line in the figure shows the long-term daily averages of incoming solar radiation in Watt per squared-meter (W/m²). The shaded area around the red line shows the standard deviation, which is a parameter that indicates how much the values of every year spread around the average, i.e. the larger the shaded area the more the values vary from one year to another. The radiation plot clearly demonstrates the extreme variations in incoming radiation caused by the alternation of polar day and polar night. During polar night, from early November to late January, values of incoming radiation are 0 W/m² because the Sun never rises. With the first sunrise, around mid-January, the amount of incoming radiation increases and keeps doing so until the period of polar day. On June 21st the sun reaches its highest elevation in the sky. This moment is called the summer solstice, and incoming radiation reaches its maximum. After the summer solstice the sun starts to sink again with the first sunset happening at the beginning of August and the measured radiation decreases until it reaches zero in November, when the polar night period starts again. Interestingly, the measured radiation curve shows large variations in the polar day period which is most likely due to increased cloudiness. The presence of clouds in the sky blocks solar radiation from reaching the ground and significantly decrease incoming radiation. However, cloudy days are not the same from one year to another and we find therefore that the average values as well as the standard deviation exhibit large variations. |
 |
Annual air temperature - The evolution of air temperature during the year is shown with the red line on the figure (the shaded area shows the standard deviation). Comparing the air temperature curve with the incoming radiation shows how tightly they are connected. During polar night, air temperatures are very low ranging from -30°C to -35°C because no warming radiation arrives from the sun. When polar night ends in January, solar radiation and air temperatures begin to increase. As the amount of incoming radiation keeps increasing, air temperatures keep rising as well, reaching a maximum value of around 9°C at the end of the polar day period. In August, when the polar day ends and night starts to fall again, no solar radiation reaches the ground during the night hours. This is also the onset of the general decrease in air temperatures. |
 |
Annual snow depth - The red line in the figure shows the average height of the snowpack in meters (the shaded area shows the standard deviation). The evolution of the snow height depends primarily on the air temperature as snow can only exist when air temperatures are below 0°C. This correlation between air temperature and snow abundance is clear when comparing the snow depth and air temperature plots: at the beginning of June, when air temperatures rise above 0°C, snow depth decreases abruptly. This sharp decrease is caused by extensive snow melting, a consequence of the positive air temperatures. While air temperatures remain above 0°C, from June to the beginning of September, there is no snow accumulation and snow depth remains at zero meter (or very close to zero). The plot shows that snow only starts to accumulate again in early September, which is also the time when air temperatures drop below 0°C. An interesting feature of the snow depth curve is its strong increase from the end of February until the onset of the great melt in June. This increase indicates that large amounts of snow precipitate late in winter and in spring, which is only possible because of the increasing air temperatures. Warm air can transport larger amounts of water than cold air, thus creating the conditions for large precipitation events. |
 |
Annual soil surface temperature - The evolution of soil surface temperature (at a depth of 2 cm) follows roughly the same pattern as the air temperature because both are determined by the warming effect of solar radiation. However, soil surface temperatures are also influenced by snow cover, which has several effects on the evolution of soil temperature. In autumn and winter, snow has an insulating effect as it covers the ground, and soil surface temperatures are therefore around 10°C warmer than the air (-20°C to -25°C vs. -30°C to -35°C, respectively). In spring, when solar radiation increases, the snow cover has the opposite effect: it blocks solar radiation from reaching the ground causing the soil to warm slower than the air. At the beginning of June, when air temperature rises above 0°C and after all snow has melted, we observe a very steep increase in soil surface temperature because the snow-free ground is directly exposed to solar radiation and heats rapidly. The decrease of soil temperature after the end of the polar day period is the same as air temperature until they both reach 0°C. At this point, the air temperature keeps dropping but the soil surface temperature reaches a plateau around 0°C before continuing to decrease. This plateau is also referred to as the ‘zero-curtain effect’, and is a characteristic of Arctic soils, also called permafrost. It corresponds to the period when the water within the soil freezes and it is this freezing process which keeps soil temperatures at 0°C and prevents a further drop in temperature. Only after all the water in the soil is frozen, can the soil temperatures decrease further. |


